
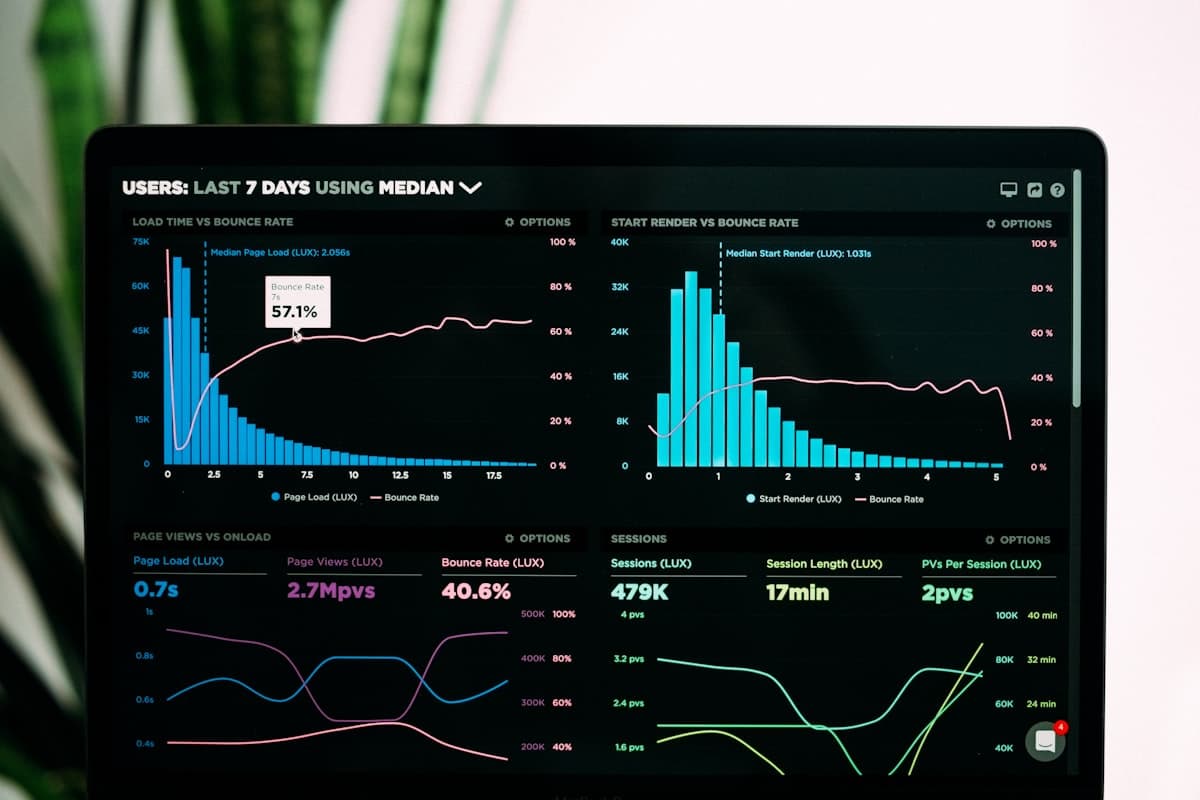
Data-Driven Maintenance: Using Portfolio Insights to Reduce Costs and Improve Service
Aggregate maintenance data reveals patterns invisible at the property level. Here's how to build a data-driven maintenance program across your portfolio.
Most property portfolios are generating more maintenance data than they know what to do with. Every work order submitted, every vendor dispatched, every asset that fails or holds — all of it accumulates in systems that rarely get used for anything beyond tracking what already happened. The information is there. The planning value mostly isn't being captured.
Data-driven property maintenance is what changes that equation. When maintenance data gets analyzed across an entire portfolio — not property by property, but as an aggregated whole — patterns surface that no single site manager could see on their own. Recurring failure clusters. Vendor inconsistencies. Seasonal cost spikes that were predictable months before they hit. These patterns are the foundation of a maintenance strategy that controls costs rather than constantly absorbing them.
Why Individual Properties Can't See What Portfolio Data Reveals
Managing maintenance at the property level feels complete when it's happening. Tickets get opened, vendors get dispatched, issues get resolved. But the picture that individual property data provides is narrow by design — it can only show what's happening at that address.
The problems that most consistently drive maintenance cost volatility don't live at the property level. They live in the patterns across properties. An HVAC failure rate that looks like bad luck at one location looks like a systematic installation or specification problem when it's happening at six similar properties across the same market. A vendor that appears responsive on a per-job basis looks unreliable when cycle times are measured across hundreds of engagements. A budget category that seems stable at individual properties reveals accelerating spend when it's tracked at scale.
Research on multi-site portfolio operations consistently finds that operators managing maintenance through disconnected, property-level systems spend 28–41% more per square foot than those running centralized, data-connected platforms. The gap doesn't come from labor rates or parts pricing. It comes from the accumulated cost of reactive decisions — emergency premiums, repeat visits, last-minute vendor sourcing — that organized portfolio data would have flagged early enough to avoid.
The shift from property-level visibility to portfolio-level insight isn't a technology upgrade. It's a decision about what maintenance data is actually for.
What Portfolio Analytics Actually Surface
Aggregating maintenance data across a portfolio doesn't just produce more of the same information at larger scale. It reveals categories of insight that simply don't exist when data stays siloed at the property level.
Failure pattern clusters. When asset performance data is viewed across dozens or hundreds of similar properties, failure curves become visible. HVAC units of a certain age in certain climate zones fail at predictable rates. Appliances in high-turnover units accumulate wear differently than those in long-term tenancies. These patterns, mapped at portfolio scale, create early warning systems that individual property teams can't build from their own data alone.
Vendor performance consistency. A vendor may look fine based on any single job. The question is what their completion rate, cycle time, and re-service rate looks like across 300 work orders over 18 months in a specific market. Portfolio-level vendor data reveals those patterns in ways that per-job assessment never can. That intelligence directly informs network decisions, SLA negotiations, and where capacity agreements need to be in place before demand peaks.
Seasonal demand concentration. Most portfolios have predictable seasonal pressure windows. The challenge is that without aggregated data, those windows feel like they arrive suddenly. Portfolio analytics quantify exactly when and where volume concentrates — by service category, by region, by asset type — which makes vendor pre-positioning and early contracting decisions both possible and financially justified.
Budget variance signals. When spending data is tracked at portfolio scale with consistent category tagging, budget variances in a specific service category become visible well before they compound. A 15% increase in plumbing-related spend across a region is a signal worth investigating. The same increase spread across individual property budgets looks like noise.
The organizations using this kind of portfolio-wide visibility consistently report 18–25% reductions in total maintenance costs compared to those managing property by property. The mechanism is straightforward: fewer emergencies, fewer repeat visits, and better-timed capital decisions, all made possible by seeing demand patterns before they fully develop.
Translating Data Into Maintenance Cost Reduction
Capturing portfolio data is step one. The operational value comes from what that data changes in day-to-day and quarter-to-quarter decision-making. The most direct path from data to maintenance cost reduction runs through three connected levers.
Shifting the planned-to-reactive ratio. Emergency and reactive repairs cost 3–5x more than identical work done on a planned basis. For a 10-property portfolio, that emergency cost premium alone can exceed $180,000 annually in avoidable expense. Every percentage point of maintenance spend moved from reactive to planned directly reduces that premium. Portfolio data makes that shift possible by identifying which assets and categories are approaching failure before the failure happens.
Tightening vendor performance management. Without portfolio-level performance data, vendor accountability conversations are difficult to have with any specificity. With it, property managers can point to exact completion rates, cycle times, and re-service frequencies across large sample sizes. That precision changes both the quality of vendor relationships and the terms those relationships operate on. Vendors who know their performance is being tracked at scale perform differently than those who aren't.
Informing capital timing decisions. Work order recurrence data on specific assets is one of the most reliable leading indicators of capital need. When a particular asset class or age cohort starts generating above-average service volume — especially repeat calls for the same underlying issue — replacement is typically 12–24 months away. Teams that catch that signal from portfolio data can plan capital spending proactively. Teams that don't catch it plan capital spending reactively, which typically means higher costs and worse timing.
Organizations that move their planned-to-reactive maintenance ratio above 80% consistently demonstrate lower total cost, extended asset lifespans, and better resident satisfaction scores. The data systems that make 80%+ achievable are not exotic — they're the same platforms that most portfolios already use. The question is whether the data they're generating is being used to drive decisions or simply to document history.
Building the Infrastructure for Portfolio-Level Insight
Knowing that portfolio data is valuable and actually having portfolio data infrastructure in place are two different things. The common gap isn't investment — it's the operational discipline required to make data clean, consistent, and connected enough to produce reliable insights.
The foundational requirement is data standardization. Work orders categorized differently across properties, asset types tracked inconsistently, vendor records managed in disconnected systems — none of that aggregates into reliable portfolio-level intelligence. Before analytics can surface meaningful patterns, the underlying data has to be structured in a way that makes cross-property comparison valid.
That means consistent category taxonomy for all work order types, standardized asset identification across the portfolio, and completion data that captures not just that a job was done but what it cost, how long it took, and whether the issue recurred. Most platforms can capture this data. The obstacle is usually the intake discipline — what happens when a work order is first submitted — rather than the system architecture.
Automation at the intake stage removes most of that variability. When work orders are categorized, tagged, and routed automatically rather than manually, the data that enters the system is consistent from the start. That consistency is what makes downstream analytics reliable. Structured data produces trustworthy patterns; inconsistent data produces noise that looks like insight but isn't.
Once the data foundation is clean, the analytical layer is straightforward: dashboards that track key metrics across the portfolio, threshold alerts for categories or properties trending above baseline, and scheduled reviews that feed portfolio patterns into planning cycles. Property management data insights only translate to decisions when they're reviewed on a rhythm that connects to when decisions actually get made — budget season, vendor contract cycles, capital planning windows.
Connecting Portfolio Insights to Service Quality
The discussion around data-driven property maintenance often focuses on cost, and for good reason — the financial impact of better maintenance decisions is concrete and measurable. But the service quality dimension is equally significant, and at the resident-facing level, it may matter even more.
Maintenance response time and resolution quality are consistently among the top factors in resident satisfaction surveys. Research on multifamily retention puts it plainly: properties with above-average maintenance performance retain residents at measurably higher rates than those with below-average performance, and the difference in renewal rates translates directly into occupancy economics. A 5% improvement in resident renewal rates across a 500-unit portfolio represents substantial NOI impact without any change to rent levels.
Portfolio analytics support service quality in several ways that individual property data doesn't. Recurring issue patterns at specific properties get flagged before they accumulate into resident complaints. Vendor performance outliers — contractors whose cycle times or resolution rates fall below network benchmarks — get identified and addressed before they affect satisfaction scores. Seasonal demand surges get anticipated and staffed proactively rather than absorbed as backlogs.
The data systems that support cost control and the data systems that support service quality are the same systems. Portfolio analytics that reveal where spend is drifting also reveal where service delivery is slipping. The insight flows from the same source; it's the operational response that differs depending on which outcome is being prioritized.
FAQ
Q: What's the minimum data infrastructure needed to start using portfolio analytics for maintenance planning? A: A centralized work order platform with consistent category tagging across all properties is the baseline requirement. You don't need sophisticated BI tools to start identifying patterns — most modern maintenance platforms include reporting capabilities that can surface cross-portfolio trends with the right data structure in place. Start with standardizing how work orders get categorized, ensure completion data captures cost and cycle time consistently, and run quarterly cross-portfolio reviews before investing in more complex analytical infrastructure.
Q: How long does it take for portfolio maintenance analytics to produce actionable insights? A: With clean, consistently tagged data, meaningful patterns typically emerge within one to two quarters of aggregated review. Seasonal demand concentration becomes visible fairly quickly once a full calendar cycle has been captured. Asset failure curves and vendor performance trends require six to twelve months of consistent data to produce statistically reliable signals. The earlier teams start building clean data habits, the faster the planning value compounds.
Q: How does portfolio data affect vendor relationships and contract negotiations? A: Portfolio-level performance data significantly changes the balance in vendor conversations. When a property manager can present a vendor with their actual completion rate, average cycle time, and re-service frequency across several hundred work orders — rather than negotiating based on general impressions — the discussion becomes specific and evidence-based. Vendors who know their performance is tracked at scale tend to prioritize those accounts, which translates to better availability, faster response, and more consistent quality over time.
Conclusion
The gap between what most property portfolios know and what their data could tell them is substantial. The work order history, asset records, and vendor performance data that already exist inside most portfolios contain the patterns needed to make maintenance more predictable, more cost-efficient, and more reliably resident-facing. The obstacle is rarely data access — it's the organizational practice of treating that data as a record of what happened rather than as a guide to what should happen next.
Operators who make the shift to portfolio-level analytics consistently find that costs stabilize, reactive emergencies decline, and capital decisions arrive at better times. None of those outcomes require exotic technology. They require clean data, cross-portfolio analysis, and the discipline to connect what the data reveals to how the next planning cycle actually gets built.
Start with the categories driving the most volume and the properties generating the most variance. Map the patterns. Feed those patterns into planning decisions before demand peaks rather than after. The data is already there — the leverage comes from using it.